
GameBreak Scouting Dashboards by RII Sports Technology
80% of your players (and most of your coaches) aren't getting anything out of your scouting reports
Studies show that 65% of all people are Visual Learners (simply put, they gain more knowledge from images and graphics than they do from reading text or tables of information). Among your players (males 18-25 years old) that number grows to 83%. You've only got so much time to help your coaches and players identify and commit to memory the keys to beating your opponent - our GameBreak Scouting Dashboards present your scouting data in a Visual, Interactive platform that helps your team more quickly recognize and more effectively memorize your opponent's tendencies, strengths and weaknesses.
|
|
Get to What Really Matters Faster, Easier
Traditional film system reports contain lots of valuable information, but aren't built for Visual Learners. A single report can contain dozens of pages of tables and charts full of data - much of it insignificant when it comes to your weekly preparation. Information that makes a difference has to be searched for and pieced together still - a time consuming and daunting task for even the most data savvy coach.
Scouting Dashboards package all of your film data into a single, interactive platform that is uniquely designed for Visual Learners. Coaches and players can instantly identify a team's every tendency, strength & weakness in any given situation. The visual design makes it easy see and commit to memory important situational information, and the interactive nature of a Scouting Dashboard means you have anything you need to know right at your fingertips. |
"Our dashboard was a tremendous asset to our championship run in 2013...our 3rd Down & Red Zone efficiency dramatically improved." |
|
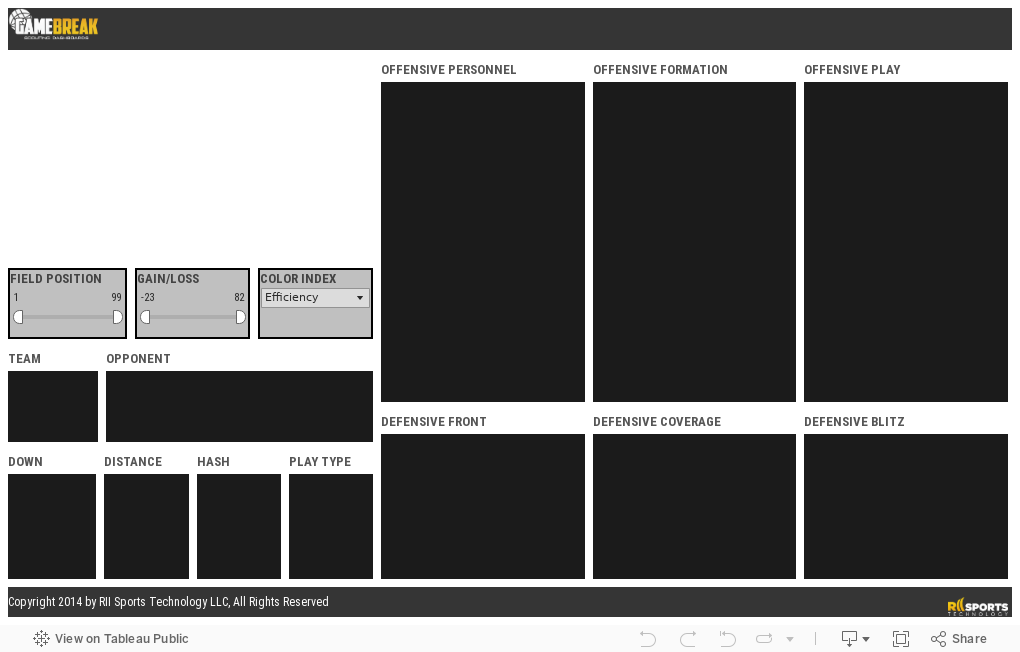
Size and Color Tell a StoryWhen your film breakdown data is packaged into a Scouting Dashboard we use the visual cues of Size and Color to instantly tell the story of the data it contains. For each category of breakdown information (Formations, Personnel Groups, Coverages, Fronts, etc) the data is packaged into a grid showing all of the various observations noted during your film study (the image at the right shows the various formations employed by an opposing offense).
Within each of these grids, Size is used to indicate the relative Strength of a Tendency. The bigger the box the stronger the tendency, the smaller the box the less likely it is to occur. Color is used to indicate Offensive Efficiency - a color scale that goes from Red (indicating very poor offensive performance) to Blue (indicating very good offensive performance). By combining these two dimensions you can instantly see not only what a team likes to do in a given situation, but also where their strengths and weaknesses lie - providing you with a roadmap of how to most effectively attack and exploit your opponent. |

|
Interact with Your Film Data
Scouting Dashboards are fully interactive - with just a click you'll be able to fully explore a team's every situational tendency from any angle you desire. You are no longer bound by the limitations of traditional film system reports (that constrain you to 2-Dimensional analysis) - you can instantly go where your coaching brain leads you.
The dashboard shown below is a simple example of how our Scouting Dashboards work. Interact with it by clicking on any of the items shown in the Data Grids (ex: clicking on "10" in the Offensive Personnel grid will show you all of the various situations, formations, plays, etc. that this Big12 team ran from 10 Personnel); use the filters under the field to narrow your study (ex: move the Field Position slider to only show plays run in the Red Zone); and place your cursor over any item to view a pop-up window containing more information.
The dashboard shown below is a simple example of how our Scouting Dashboards work. Interact with it by clicking on any of the items shown in the Data Grids (ex: clicking on "10" in the Offensive Personnel grid will show you all of the various situations, formations, plays, etc. that this Big12 team ran from 10 Personnel); use the filters under the field to narrow your study (ex: move the Field Position slider to only show plays run in the Red Zone); and place your cursor over any item to view a pop-up window containing more information.
Working with RII Sports Technology
|
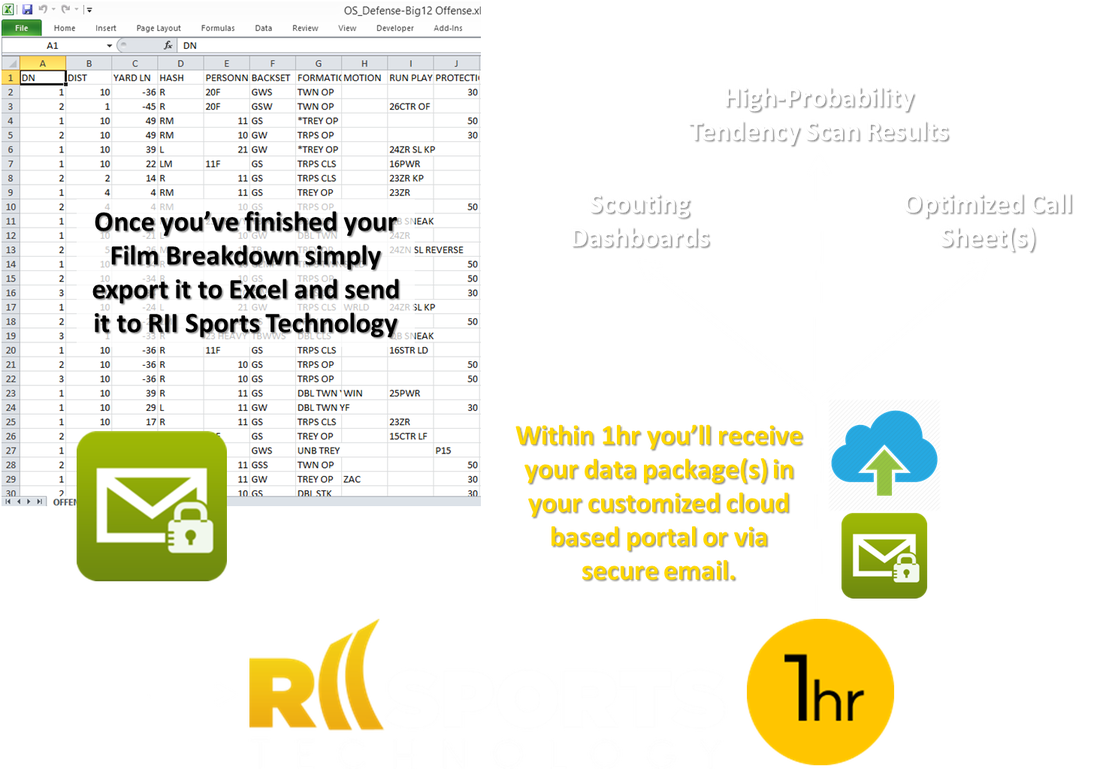
Accessing our services couldn't be more easy. You've already done the hard part by breaking down film. You simply export your film breakdown data to an Excel file and submit that to us via our secure e-mail address. That's it. Within 1 hour you'll receive your Scouting Dashboard back. And if at any point you need assistance you can call us on our 24 hour hotline.
|
|
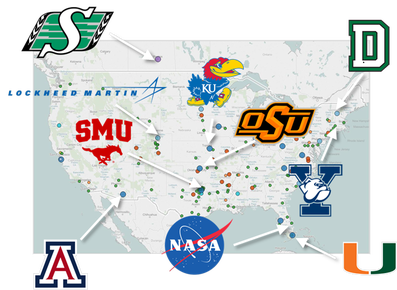
Our Clients
We bring the same quality, expertise and proprietary processes that have made us a hit with NASA, Lockheed-Martin and Boeing to our more than 100 football clients nationwide at all levels of competition.
|
|